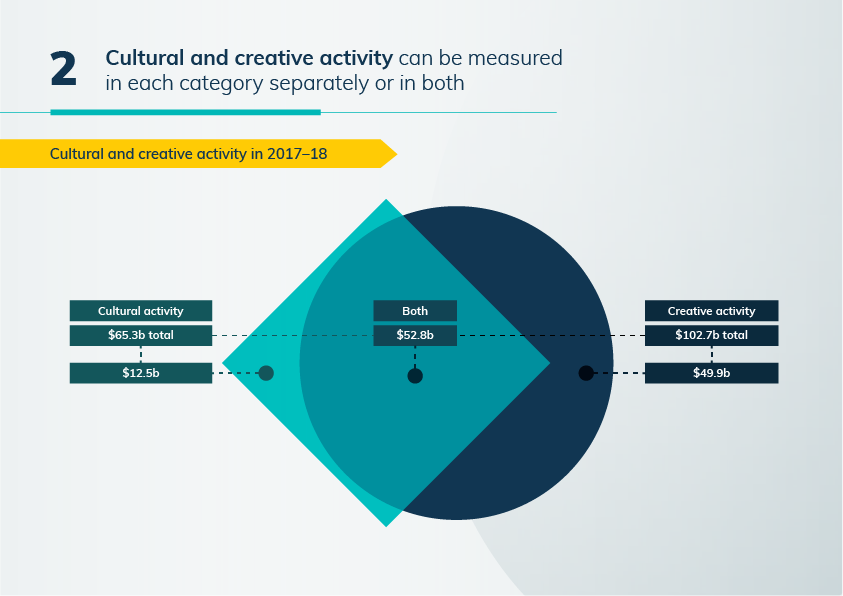
Analysis shows cultural and creative activity contributed $115.2 billion to Australia’s economy in 2017–18.
Conducted by the Bureau of Communications, Arts and Regional Research (BCARR), the analysis indicates cultural and creative activity accounted for 6.3% of Australia's gross domestic product (GDP) over this 12-month period.

Cultural and creative activity includes the arts, media, heritage, design, fashion and information technology.
This activity contributed $115.2 billion to Australia's economy in 2017–18, a 34% increase over the decade—up from $86 billion in 2008–09.
Cultural and creative activity can be measured in each category separately or together.

The publication tracks annual growth in cultural and creative activity based on data from the Australian Bureau of Statistics, measuring the economic activity driven by cultural and creative industries as well as the wages received from cultural and creative occupations in other industries.

Design has experienced significant growth over the past decade, driven mainly by computer system design and related services.

The BCARR will continue to update these estimates on an annual basis.
More information:
- Visual summary: Cultural and Creative Activity estimates 2008-09 – 2017-18
- Explanatory notes: Cultural and Creative Activity estimates 2008-09 – 2017-18
- Fact sheet: Cultural and Creative Activity estimates 2008-09 – 2017-18
- See the previous BCAR report: Cultural and creative activity in Australia, 2008-09 to 2016-17