A speech by Steven Kennedy to the Research School of Economics, Australian National University
I"d like to begin by acknowledging the traditional owners of the land on which we meet today and pay my respects to Elders past and present.
Thank you for the opportunity to speak to you this evening. I was very pleased to receive the invitation to give this speech from Bob Gregory, who is an Emeritus Professor at the Research School of Economics.
Bob has been a mentor of mine and many others in the public service. He has a great capacity to stimulate thinking, develop policies underpinned by evidence, and bring to the forefront of public debate the key issues that confront governments and society.
Australia is lucky to have a number of economists in this vein and I would include Bruce Chapman and Jeff Borland among many others.
Connecting the work of academics such as these to the public service has been, and will continue to be, important to achieving quality public policy outcomes.
My remarks this evening will be in two parts.
At the Department of Infrastructure, Regional Development and Cities, we are especially interested in understanding how economic activity is distributed, what drives changes in the distribution and more broadly, the spatial features of the economy and society.
In the first part of my speech, I"ll discuss what could be termed global forces that are shaping economies and societies. In doing this, I will draw out differences in how these global forces are affecting countries, with a focus on the US and Australia.
Recently the Government commissioned a major review of the public service. In the second part of my speech, I"ll discuss changes in the public service and suggest areas for reform.
Global forces at work
A couple of weeks ago the Productivity Commission (PC) released a report on inequality. It was a typical piece of research from the PC: thoroughly researched, insightful, it directly addressed myths, occasionally missed the point, and in places, was a little stuck in the economist mindset.2
In summary, it was a substantial contribution to the debate about inequality in Australia.
The first chart in the report was this one.
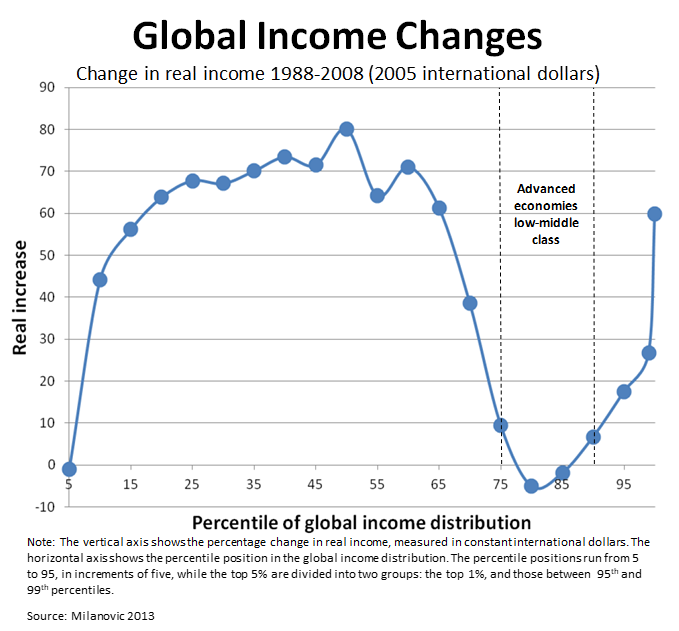
The chart shows the real increase in income across the global income distribution. For example, people in the middle of the distribution experienced an increase of around 70 per cent in their incomes between 1998 and 2008.
It's a great chart to start the conversation about the massive leap forward the world has taken in terms of economic opportunity.
The improvement in China's economic outcomes are the central feature of this leap forward, with the middle of the global income distribution being dominated by people from China and to a lesser extent India.
The World Bank estimates that since the 1980s, more than 500 million people have been lifted out of poverty in China. That's 500 million people who were previously living on less than US$1.90 dollars a day.3
The focus for many developed countries is the dip in the chart—the outcomes for relatively high income countries.
Here, at the dip, income has hardly increased and in some countries, inequality has significantly increased or remained at a relatively high level.4
The cause célèbre is the US where poor outcomes for many are sometimes used as an illustration of a broader global trend.
However, there are considerable variations in economic outcomes for developed countries.
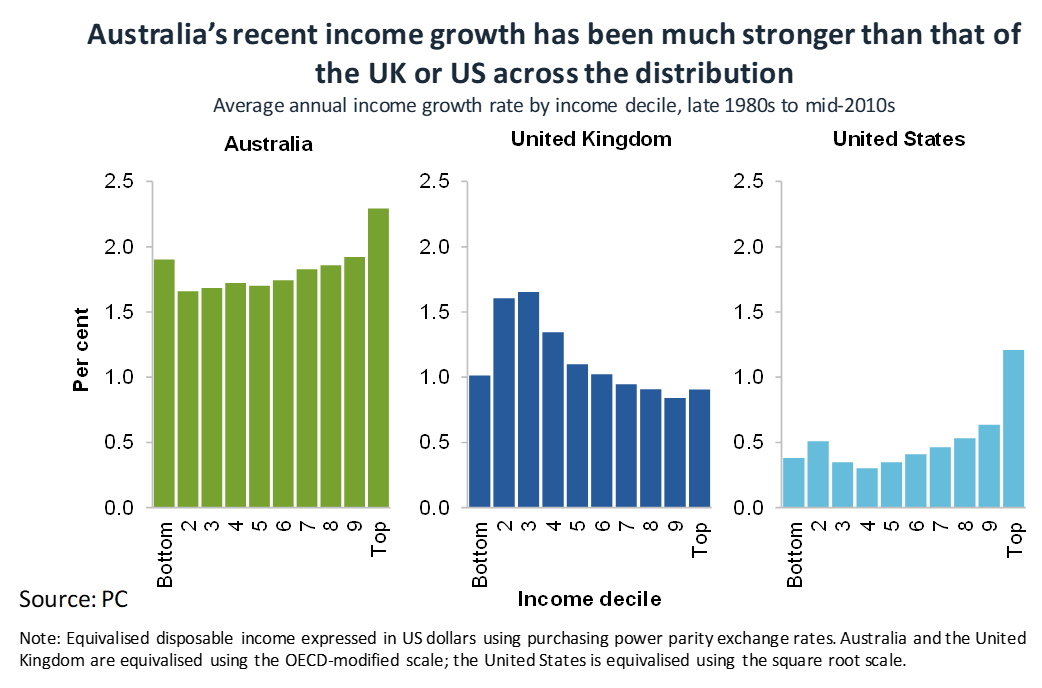
This next chart, also taken from the recent PC report, compares growth in incomes across the income distribution in the US, UK and Australia.
Australia's sustained economic growth over nearly three decades has seen incomes increase across the income distribution ahead of those in the US and the UK.
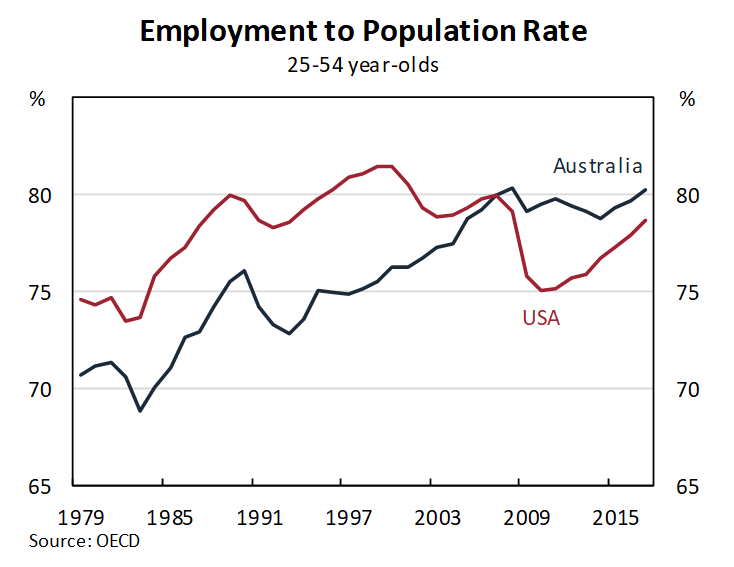
We can also see differences in employment outcomes across countries.
This chart shows employment outcomes for the US and Australia and illustrates that at an aggregate level the Australian labour market has performed well over a long run of years.
The US employed a larger proportion of its population than Australia for several decades before the global financial crisis. However, over the past decade the opposite has been true.
Despite significant variation by country, it is the US outcomes that tend to dominate the discussion about developed economies" prospects and implications for policy.
There is a question here about where Australia should look to for comparative public policy analysis.
We go to the US because firstly, the US has been seen to be at the productivity frontier and secondly it is where many of the world's leading economic researchers are.
But perhaps we should be systemically looking more to a wider basket of countries, including ones that are resource-intensive, like Canada and Norway.5
Having made this point, I"m going continue with US comparisons!
There is a substantial amount of research going on to better understand the US outcomes at a disaggregated level and especially from a spatial perspective.
One line of research focuses on the re-emergence of China and its impact through trade.
We can see this impact through the research of David Autor and colleagues who find that China's average current account surplus rose from 1.7 per cent of GDP in the 1990s to 4.8 per cent in the 2000s. In mirror-like fashion, the average US current account deficit rose from 1.6 per cent of GDP in the 1990s to 4.4 per cent in the 2000s. 6
Further, they have shown how many of those displaced from their jobs though the trade adjustment have not found alternative employment where they live and nor have they moved.
These results have not been what many trade economists would have expected.
The Autor research suggests that the effects of the trade adjustment have both reduced wage growth in the US and changed the distribution of economic opportunity, with the distributional effects being sticky and leading to regions of pronounced disadvantage.6
They find that some areas of the US were especially negatively affected by China's rise, partly because those areas had lots of jobs in industries where imports surged the most. Majorly affected industries included furniture, toys, electronic components and motor vehicle parts.
As can be seen in the following chart, the areas most affected were in the eastern inland states. The red markings indicate those areas most affected.

It is worth reminding ourselves that we are looking back over global forces and some of these forces and effects may dissipate. As China's incomes increase, and it becomes a middle income country, its impact on countries like the US will lessen. In other words, we may be close to the end of a significant adjustment period.
Nevertheless, these outcomes go some way to explaining the loss of support for open trading arrangements in the US, despite the large gains in global welfare.
Not surprisingly, there is keen interest in Australia in understanding whether similar patterns are at play here as a result of China's emergence, especially the spatial implications.
At least at a superficial level, the spatial features of the US economy are harder to see here in Australia.
Like the US, the Australian economy has been shaped by growing trade with China. However, the impacts in Australia were overall more positive than in the US.7
We can see this in recent research by the RBA which examines how labour markets vary across regions. Their research shows labour market conditions have been becoming more similar over time.
To illustrate this, this chart shows the dispersion of unemployment rates across the country and shows that the standard deviation of the unemployment rate across the 87 individual regions for which the ABS publishes data is markedly lower than it was 20 years ago.8
National Unemployment and variation in Regional Unemployment
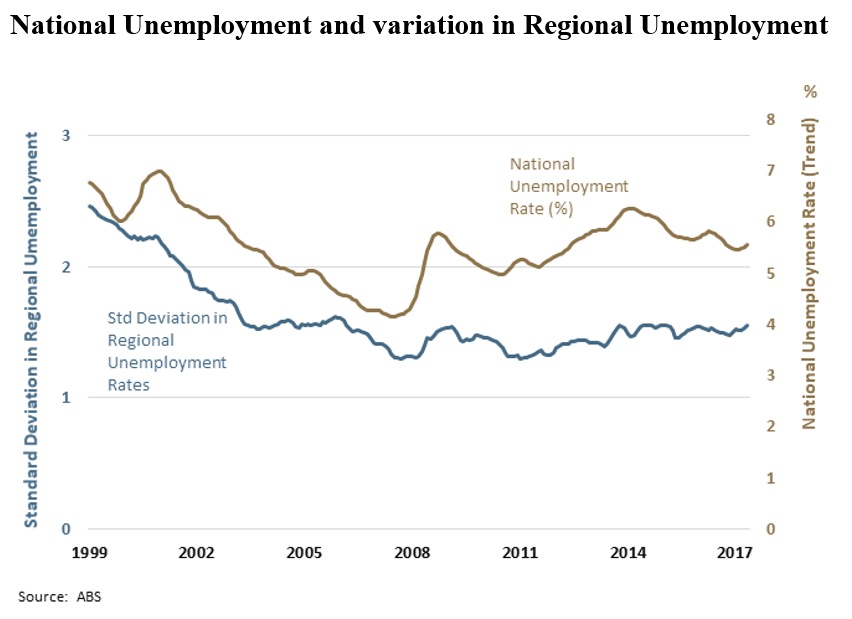
Other research also suggests that the distribution of outcomes across regions has not worsened as it has in the US. Research by the PC shows that many regions in Australia are doing well and that there has been less variation in the distribution of outcomes over time.9
One of the most obvious ways that China has impacted Australia through trade is via the mining boom.
The PC found that while the mining boom caused transitional pressures, it also made Australians substantially better off in the short and long term.
Similarly, the RBA found that by 2013 the mining boom had boosted real per capita household disposable income by 13%, raised real wages by 6% and lowered the unemployment rate by 1.25 percentage points. Further, that the increase in domestic demand for manufacturing as an input into mining outweighed the ‘Dutch disease’ effect of an appreciating Australian dollar. 10
While the spatial outcomes for Australia appear more positive than the US, we should not become too complacent. As noted by my colleague David Gruen and others, unemployment disparity tends to move in line with unemployment in Australia, the UK and the US.11
In other words, if the labour market was to weaken and the aggregate unemployment rate was to rise, we may see an increase in the dispersion of outcomes across regions.12
Summarising these results for Australia, I think we can still safely conclude that the spatial outcomes for Australia have been more positive than the US.
And that the source of disadvantage that is present for some Australian regions likely differs from what we have seen more recently in the US.
There will be factors at play other than trade leading to the differences between the US and Australia, including policy differences.
In a recent paper David Gruen draws attention to the much more active role Australia plays compared to the US in supporting labour market adjustment and points to the importance of education reform, labour market programs and specific help for disadvantaged regions. In his paper David notes comments from Ben Bernanke the former Chair of the US Federal Reserve.
Ben Bernanke, had this to say:
‘It's clear in retrospect that a great deal more could have been done, for example, to expand job training and re-training opportunities, especially for the less educated; to provide transition assistance for displaced workers, including support for internal migration; to mitigate residential and educational segregation and increase the access of those left behind to employment and educational opportunities; to promote community redevelopment through grants, infrastructure construction, and other means; and to address serious social ills through additional programs, criminal justice reform, and the like. Greater efforts along these lines could not have reversed the adverse trends [described earlier in the speech] … but they would have helped."
I"d note that these policy responses would play an important role regardless of the source the shock.13
Another potential global force or shock that may impact the labour market and have spatial implications is automation.14
In particular, there are concerns that employment will become less secure in the face of rapid technological advances.
There has been some excellent work done by Andrew Charlton on the opportunities that can arise if policy makers assist the community in responding to the challenges presented by automation.15
And it is possible that some of the impacts of these changes will be positive for regional economic outcomes. For example, Andrew notes the importance of personal care services, illustrated in Australia through the NDIS, and their increasing relevance in a future economy.9
But perhaps we should not get too excited about the impact of this global force just yet. Jeff Borland has explored labour market outcomes for Australia for signs of significant shifts in employment arrangements and outcomes.16
Jeff found that over recent years, the proportion of people in short-duration jobs has been falling, and the proportion in long-duration jobs rising.
It's probably fair to say that the so called ‘Jobs for the Future’ thesis is running much the same way as the ‘Computer age productivity boom’, they are both present everywhere except in the data, to borrow from Robert Solow's famous comment about the computer age.17
So perhaps this is a global trend to watch for and, from my department's perspective, to study carefully its potential spatial features.
Related to global trends in technology is the long-term shift in the share of services in economic activity and employment, and the rise in importance of cities.
This chart shows the share of services for the US and Australia as a proportion of employment.
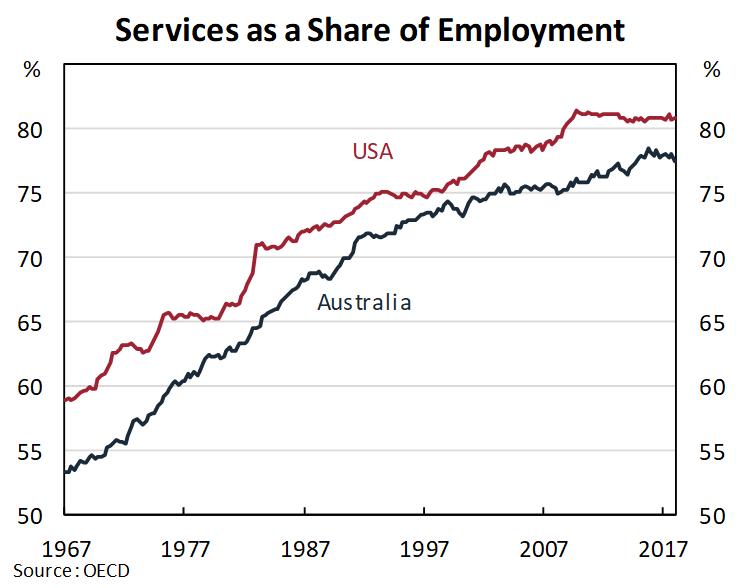
The increasing dominance of services is associated with urbanisation and cities.
Globally, more people are living in cities as a proportion of the population than ever before.
In advanced economies, the population share of urban areas has increased from around 65 per cent in 1960 to over 80 per cent today.18
In absolute terms, the urban population of the world has grown rapidly from 751 million in 1950 to 4.2 billion in 2018.19
This is an area where Australia has been well ahead of global trends—our extent of urbanisation has been relatively high since the 1970s. In Australia, our 21 largest cities (cities larger than 85,000) account for around 80 per cent of the population.
Perhaps the best known research on the role of cities is that of Harvard Professor Edward Glaeser (and colleagues), who point to the economic benefits of cities or agglomeration benefits.
The rise of cities is explained by their higher productivity, which creates wealth and draws in population. The productivity advantage of cities partly reflects the tendency for highly skilled and educated workers to live in cities.
But, even controlling for skill levels across workers, increases in city population size and density still correlate with higher productivity.20,21
By supporting a higher concentration of economic activity, larger cities appear to enjoy some natural advantages over smaller cities in hosting the critical knowledge and professional services sectors.
Larger cities can provide large pools of highly skilled workers and cheaper access to non-traded inputs that can be shared locally by firms.
The physical proximity of these firms to each other and suppliers encourages knowledge spillovers, providing a fertile environment for skill acquisition, ideas exchange and innovation.
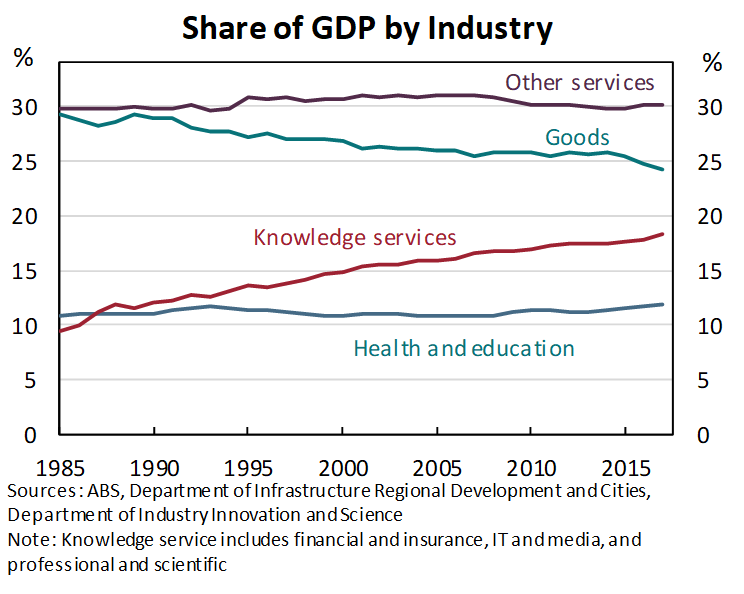
Within the increase in services I noted earlier, there is an even more rapid increase in knowledge services.
Workers in these industries tend to earn higher pay, a reflection of their higher productivity, which creates wealth and stimulates local demand.
And these positive effects tend to spill over to other workers.
Research by Enrico Moretti has shown that for every new innovation job in a city, five additional non-innovation jobs are created, and those workers earn higher salaries than their counterparts in other cities.22
This brings me to an important caveat to city size and density effects—that is the increase in productivity beyond that which can be explained by worker characteristics.
Glaeser and Resseger23 found that the relationship between city size and per capita income only holds for those cities with the most skilled populations. That is, the city size and density effect is not present for cities in which a relatively low proportion of the population is low skilled.
This is a subtle effect and worth reflecting on.
Let me put it another way—a large city with a high proportion of skilled workers will be more productive than a small city with the same high proportion of skilled workers.
A large city with a low proportion of skilled workers will be no more productive than a small city with the same proportion of skilled workers. Size and density are having no effect in this case.
In a quick examination of the data for Australia we can see some of these features I"ve described for cities.
For example, in Australia's four largest cities, the share of people with tertiary qualifications is 29 per cent, compared to around 18 per cent for the rest of Australia.
The share of economic activity devoted to knowledge services is rising in Australia as shown in the following chart.
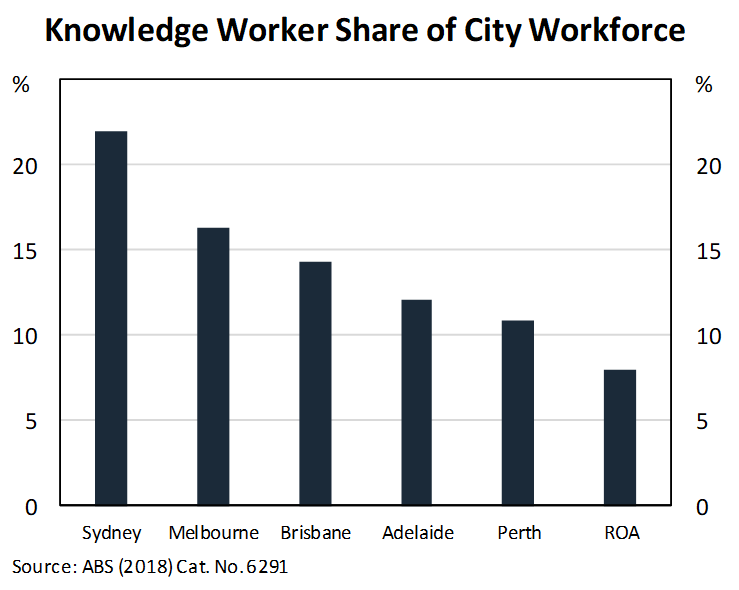
And there are differences in the shares of knowledge workers across Australian cities.
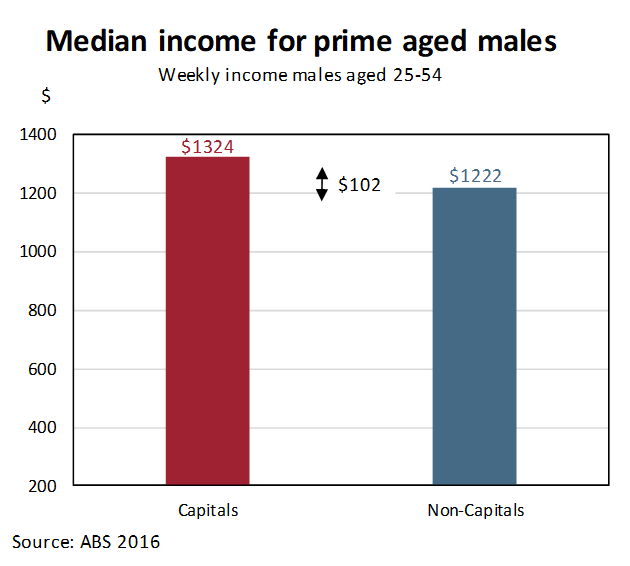
Further, a comparison of capital and non-capital cities, to illustrate average city size effects, shows that there are differences in the level of income across cities. For example, there was a $200 a week income gap between the residents of capitals and non-capitals in 2016.
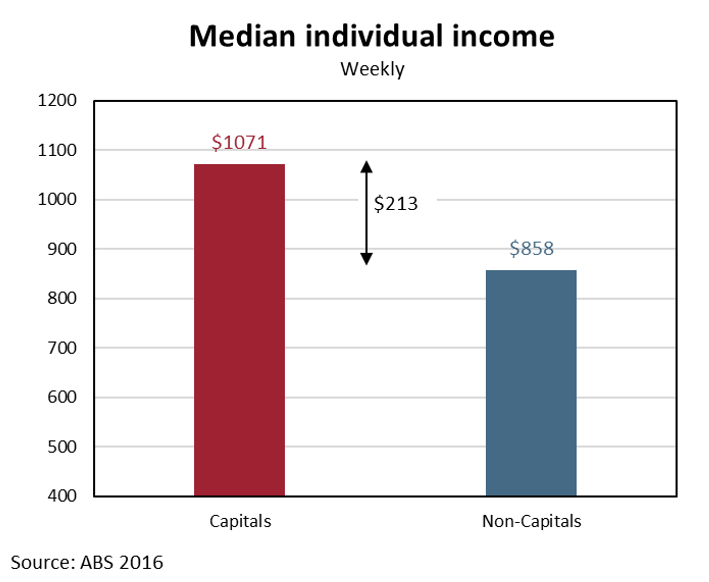
A significant portion of this difference can be explained by differences in the age profiles of capitals and non-capitals, with the non-capitals tending to have a higher proportion of older residents.
To remove some of this effect we can compare the incomes of prime age males and we find a smaller difference.
Another way to examine the relationship between the age distribution and average incomes is to plot the proportion of low income households against the proportion for Australian cities. As older Australians have lower incomes and there are higher proportions of older people in regional cities, we"d expect a higher proportion of low income households in regional cities.
We see this in the following chart which shows each city's share of low income earners against its share of older people.
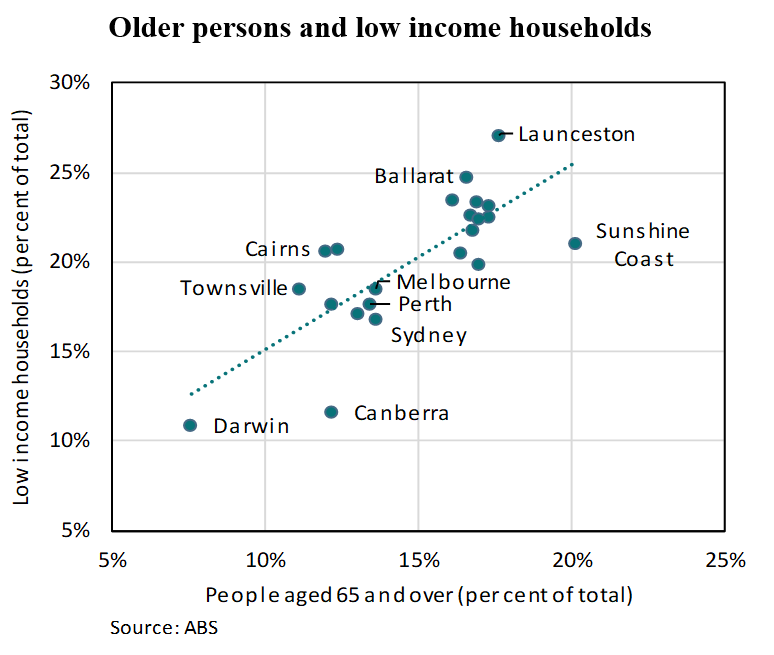
To fully explore these differences, we need to control for the education differences I spoke about earlier as well a range of other features.
Nevertheless, there is preliminary evidence of features described earlier being present across Australian cities.
And while I don"t have time to talk about it this evening, there are significant differences in the population growth rates of Australian cities, which is also suggestive of some of the city effects discussed earlier.
Global trade, the rise of China, the leap forward in global welfare, automation, the rise of services and cities are just of few of the global forces or trends I could have discussed.
There are many others just as, if not more, significant than these.
I focused on the ones I described because of their particular relevance to the role of my department, especially cities and regional development.
So how should we sum up these global forces?
I suppose we could say that in developed economies we are societies that mostly live in cities.
That people are mostly engaged in delivering services to our fellow citizens.
That we are experiencing global trade patterns that are hugely beneficial to most of the world but disastrous for some.
That there are significant differences in how developed countries are experiencing these changes.
Further, that we are a society worried about technological developments such as automation, although from a labour market perspective we are yet to see dramatic changes in the nature of work.
Lastly, that government policy matters in the face of these changes, including policies to assist and shape transitions within the economy.
Reflections on the public service
The capacity of the public service to understand the forces shaping the Australian economy and society is essential if we are to effectively advise governments.
However, a high performing public service needs to be able to do much more than consider global trends if it is to effectively deliver Government programs, administer laws and regulations, and run operations.
So it is a good time to discuss the future of the public service given the review being conducted by David Thodey, Maile Carnegie, Glyn Davis, Gordon de Brouwer, Belinda Hutchinson and Alison Watkins.
The review represents a wonderful opportunity to analyse, and re-set where necessary, a federal public service that for over 100 years has served Australians well, through 30 Prime Ministers and their governments.
It is worth briefly reflecting on how the Federal Public Service has changed over the past 40 years.
40 years ago, in 1978, there were 159,000 public (federal) servants representing 1.1% of the population and government expenditure was 25% of GDP. Of that expenditure, welfare expenditure represented 28%. Apart from versions of most of the same departments we have today, there was a public employment agency, Medibank was being disbanded with a continued reliance on private health insurance, there was a GBE called Telecom Australia which had been founded 3 years earlier, the Federal Government owned and operated hundreds of airports and a range of other Government business including banks. Defence expenditure represented 9% of government expenditure and was supported by a defence industry strategy. Interest rates were set by the Government and the exchange rate was managed. Australia's population was 14.4 million.
20 years ago, in 1998, there were 121,000 (federal) public servants representing 0.65% of the population and government expenditure was 24% of GDP. Of that expenditure, welfare expenditure represented 36%. Apart from versions of most of the same departments we have today, employment services were outsourced, Medicare had been established as bipartisan policy, the airports had been sold or leased, Telecom privatised, and a range of other Government businesses had been sold. Defence industries represented 8% of government expenditure and capability was underpinned by an off the shelf approach to purchasing. Interest rates were set by the RBA in response to a policy set by Government and we had a flexible exchange rate. Australia's population was 18.7 million.
Today in 2018 there are 152,000 public servants representing 0.6% of the population and government expenditure is 25% of GDP. Of that expenditure, welfare expenditure represents 36%. Apart from versions of most of the same departments we have today, Medicare is still bipartisan policy, there are three new GBEs among others, Western Sydney Airport Co, the National Broadband Network and Moorebank Intermodal Terminal. The National Disability Insurance Scheme has been created and all things given will increase the scope of government by 1.3% of GDP by 2044-45.24 The airports are still sold or leased but there are calls to regulate them more robustly. And we have seen a bipartisan approach to the biggest planned investment in defence capability for many years underpinned by a strategy to re-establish an Australian defence industry. Interest rates are still set by the RBA in response to a policy set by Government and we still have a flexible exchange rate. And today the population is over 25 million.
Compared to 40 years ago, the public service is expected to be more adept at providing services, not only to keep pace with modern expectations of service delivery but also because of the growing number of Australian we are expected to serve.
For example, for income support recipients alone, ignoring many other payments such as family allowances, supplementary payments, family tax benefits etc, the number of recipients has increased, with population, from 2.1 million in 1978 to nearly 5 million in 2018.25
Further, the capacity to establish and appropriately govern institutions such as the NDIS and government companies such as the Western Sydney Airport Co, is being called upon more than in the past.
The use of institutions (bodies that sit apart from departments and often established through legislation) to deliver government policy is a long term trend that has served governments well.
My interest in institutions stems from own experience, spending a number of years working at the ABS.
From my own experience, I have seen institutions such as the ABS, RBA, PC, ACCC, and in the infrastructure and transport portfolio AMSA, CASA, Airservices Australia, ATSB and Infrastructure Australia, serve governments highly effectively.
These institutions allow us to build sustained capability in a way departments can struggle to do.
Much of the research I have drawn upon this evening has been undertaken by institutions or, in the case of my department, from our standalone analytical function, the Bureau of Transport, Infrastructure and Regional Economics.
Institutions are not without fault—their greatest strength is their biggest weakness, from expertise and uniqueness of role can arise inflexibility, arrogance and insularity. But in the main, our institutions manage these tendencies well enough.
The pressures on departments to serve governments across the torrent of issues governments face on a daily basis are substantial. Departments have a much harder time of it than institutions and this has both time and content dimensions. I should say that I don"t regard the increasing load of short turnaround advice as a distraction from the real work of the public service, it is another and real demand of government that the public service has to respond to, and we can do that through capability, culture and structure.
Let me finish by making a couple of quick comments on some of the issues that come up in discussions on the federal public service review.
Capability: There is a suggestion in many peoples" conversations about the public service that there has been a loss of capability. I don"t agree with this. For example, the quality of graduates the Service takes in every year is of the highest order. We continue to have little trouble attracting committed and motivated staff, with excellent academic credentials. This has been the case for many years. From this starting point, the service has built a highly capable workforce.
Expertise: With such a wide variety of tasks to deliver for governments, the public service has to develop deep expertise. As noted earlier, one way to do this is through public institutions rather than departments, but departments also need this expertise. There are many aspects of this question and too many for me to cover this evening but let me mention one: the acknowledgement that we need to invest in groups of professional services, such as analytical services, to better understand changes in society in order to advise governments effectively.
A colleague of mine once suggested to me that the approach to expertise in the public service must be that of a serial expert. Public servants must spend sustained time on issues, they must be trained, and they must engage with business, the community and academia. This avoids the curse of the gifted amateur where smart and capable people not married with deep knowledge make unnecessary mistakes by not seeing the subtleties.26
Risk Aversion: The pressure on public servants to get it right is immense. Today, it seems to me that the expectation is that we get it 100% right 100% of the time (and there are many different views of what 100% right is!). The response to this heightened expectation can"t be to take less risk or to not take the appropriate level of risk in pursuing policy. Instead the approach has to be to open up a conversation with the community about why the risk is worth taking, the returns that can be derived, associated with an honest conversation about when it doesn"t come off. Easy to say, harder to do.
Fragmentation or Silos: This is an issue both within and across departments, and between public services. Let me make a couple of remarks about the latter. There is a need for the federal public service to be far better connected to state and local government public services.
For example, to deliver on policies that address issues of a spatial nature, such as cities policy, is crucial. Mechanisms to promote significant movement of public servants between levels of government would be a good start. Many of the policy issues we confront are complex, multifaceted and require the skills of public servants familiar with the challenges of all levels of government as well genuine engagement outside of the public service. Nic Gruen has an insightful take on these issues through his characterisation of policy problems as thick and thin.27
Trust: The public service's ability to execute its many functions relies on trust. In most developed countries trust in government is at record lows. This is also the case in Australia as shown in the Edelman index.28 Interestingly, not all public services or aspects of government are suffering the same decline in trust. For example, OECD research shows that trust in public servants in delivering health services, education and police remains high.29
The direct exposure that the community has committed to public servants, such as nurses, is in my mind an important element of this trust.
I have found in my career that the broader group of public servants I have worked with have been just as committed to the public interest as the nurses I trained and worked with more than 30 years ago. There is something special about a commitment to public service. But the community is increasingly sceptical and we have to address this scepticism to be effective.
I think a good start would be more engagement across the board. More engagement with the community, with business and with academics, where we can test ideas, be straightforward about what the government expects of us in our various policy domains, and occasionally take a risk. This is perhaps more important than ever in the face of the global forces I discussed earlier that can disrupt economies and communities.
I want to thank the ANU for the opportunity to give this speech. It has been a great personal and professional privilege to have retained a close association with many at the ANU over many years.
Thank you for the opportunity to speak with you this evening.
References
AlphaBeta for Google Australia. (2017). The Automation Advantage. Retrieved from www.alphabeta.com/our-research/the-automation-advantage/
Ahrend et al. (2017). What makes cities more productive? Evidence from five OECD countries on the role of urban governance. Journal of Regional Science. 57 (3).
Australian Government Department of Industry, Innovation and Science. (2018). Flexibility and growth 1/2018. Office of the Chief Economist Industry Insights. Retrieved from publications.industry.gov.au/publications/industryinsightsjune2018/documents/IndustryInsights_1_2018_ONLINE.pdf Autor, D et al. (2016). The China Shock: Learning from Labor Market Adjustment to Large Changes in Trade. Annual Review of Economics 8: 205–240.
Autor, D et al. (2016). The China Shock: Learning from Labor Market Adjustment to Large Changes in Trade. Annual Review of Economics 8: 205–240.
Borland, J. (2017). Job insecurity in Australia—no rising story. Labour Market Snapshot #39.
Bureau of Infrastructure, Transport and Regional Economics. (2017). Progress in Australian Regions Yearbook 2017. Retrieved from bitre.gov.au/publications/2017/regional-yearbook-2017.aspx#economy
Bureau of Infrastructure, Transport and Regional Economics. (2012). Traffic Growth: Modelling a Global Phenomenon (Report 128). Retrieved from bitre.gov.au/publications/2012/files/report_128.pdf
David, PA. (1990). The dynamo and the computer: an historical perspective on the productivity paradox. American Economic Review.
Department of Industry, Innovation and Science. (2018). Industry Insights (1/2018) Flexibility and Growth.
Department of Social Services. (2018). DSS Payment Demographic Data. Retrieved from data.gov.au/dataset/dss-payment-demographic-data
Department of Social Services. (1978). Annual Report 1977–78.
Downes, P., Hanslow, K. and Tulip, p. (2014). The Effect of the Mining Boom on the Australian Economy. Research Discussion Paper. Reserve Bank of Australia.
Edelman. (2018), 2018 Edelman Trust Barometer Global Report, page 6. Retrieved from edl.mn/2suM6O5
Glaeser, E.L. (2011). Triumph of the City—How Urban Spaces Make Us Human. MacMillan. United Kingdom.
Glaeser, E.L, Resseger, M, G. (2009). The Complementarity Between Cities and Skills. Working Paper 15103. National Bureau of Economic Research.
Gruen, D. (2017). Policy. #33 (iii). The Future of Work. Centre for Independent Studies
Gruen, D. (2018). Chief Economist Panel: The Future of Work; Australia's Place in the World. Australian Conference of Economists 11 July 2018. Comments by Dr. David Gruen, Deputy Secretary Economic and G20 Sherpa, Department of the Prime Minister and Cabinet.
Gruen, D et al. (2012). Unemployment disparity across regions. Economic Roundup Issues 2, 2012. Retrieved from treasury.gov.au/publication/economic-roundup-issue-2-2012-2/economic-roundup-issue-2-2012/unemployment-disparity-across-regions/
Gruen, N. (2017). Evidence based policy: Why is progress so slow and what can be done about it?. Retrieved from apoorgau.files.wordpress.com/2017/12/apo-forum-2017-session4-gruen-slides.pdf
Lowe, P. (2018). Regional Variation in a National Economy. Address to the Australia-Israel Chamber of Commerce, 11 April 2018. Retrieved from www.rba.gov.au/speeches/2018/sp-gov-2018-04-11.html
Lowe, P. (2018). Australia's Deepening Economic Relationship with China: Opportunities and Risks. Address to the Australia-China Relations Institute, 23 May 2018. Retrieved from www.rba.gov.au/speeches/2018/sp-gov-2018-05-23.html
Maude, F. (2017). The Future of the Civil Service. Address to the Speaker's House. Retrieved from www.scribd.com/document/358809909/Speaker-s-Lecture-Maude
Moretti, E. (2012). The New Geography of Jobs. Houghton Mifflin Harcourt.
OECD. (2017). Government at a Glance 2017. Retrieved from www.oecd.org/gov/government-at-a-glance-2017-highlights-en.pdf
Parliament of Australia (2017). The National Disability Insurance Scheme: a quick guide. Retrieved from www.aph.gov.au/About_Parliament/Parliamentary_Departments/Parliamentary_Library/pubs/rp/rp1617/Quick_Guides/NDIS
Productivity Commission. (2018). Rising inequality? A stocktake of the evidence. Retrieved from www.pc.gov.au/research/completed/rising-inequality/rising-inequality.pdf
Productivity Commission. (2017). Transitioning Regional Economies, Study Report 2017. Retrieved from www.pc.gov.au/inquiries/completed/transitioning-regions/report/transitioning-regions-report.pdf
Reserve Bank of Australia. (2016). Structural Change in China: Implications for Australia and the World. Retrieved from www.rba.gov.au/publications/confs/2016/pdf/rba-conference-volume-2016.pdf
United Nations. (2018) World Urbanization Prospects 2018. Retrieved from www.un.org/development/desa/publications/2018-revision-of-world-urbanization-prospects.html
World Bank. (2018). The World Bank In China. Retrieved from www.worldbank.org/en/country/china/overview#3.
World Bank. (2018). Urban population (% of total). Retrieved from data.worldbank.org/indicator/SP.URB.TOTL.IN.ZS?view=map
1 I would like to thank Gary Dolman, Louise Rawlings, and Oliver Richards for their substantial assistance in preparing this speech. I would like thank Mark Cully, Gordon de Brouwer, David Gruen and Jason McDonald for helpful comments. All views and errors are my own.
2 Productivity Commission. (2018). Rising inequality? A stocktake of the evidence. Retrieved from www.pc.gov.au/research/completed/rising-inequality/rising-inequality.pdf
3 *In 2011 Purchasing Power Parity terms. World Bank. (2018). The World Bank In China. Retrieved from http://www.worldbank.org/en/country/china/overview#3.
4 Productivity Commission. (2018). Rising inequality? A stocktake of the evidence. Retrieved from www.pc.gov.au/research/completed/rising-inequality/rising-inequality.pdf
5 Thanks to Mark Cully for this point.
6 Autor, David et al. 2016. The China Shock: Learning from Labor Market Adjustment to Large Changes in Trade. Annual Review of Economics 8: 205–240.
7 Lowe, P. (2018). Australia's Deepening Economic Relationship with China: Opportunities and Risks. Address to the Australia-China Relations Institute, 23 May 2018. Retrieved from www.rba.gov.au/speeches/2018/sp-gov-2018-05-23.html
Reserve Bank of Australia. (2016). Structural Change in China: Implications for Australia and the World. Retrieved from www.rba.gov.au/publications/confs/2016/pdf/rba-conference-volume-2016.pdf
8 Lowe, P. (2018). Regional Variation in a National Economy. Address to the Australia-Israel Chamber of Commerce, 11 April 2018. Retrieved from www.rba.gov.au/speeches/2018/sp-gov-2018-04-11.html
9 Productivity Commission. (2017). Transitioning Regional Economies, Study Report 2017. Retrieved from www.pc.gov.au/inquiries/completed/transitioning-regions/report/transitioning-regions-report.pdf
10 Downes, P., Hanslow, K. and Tulip, p. (2014). The Effect of the Mining Boom on the Australian Economy. Research Discussion Paper. Reserve Bank of Australia.
11 Gruen, D et al. (2012). Unemployment disparity across regions. Economic Roundup Issues 2, 2012. Retrieved from treasury.gov.au/publication/economic-roundup-issue-2-2012-2/economic-roundup-issue-2-2012/unemployment-disparity-across-regions/
12 Further, and somewhat counter to the earlier results I cited, Mark Cully and colleagues at the Industry Department have found that Gross Regional Product (GRP) growth has not been uniform over the past 15 years. 70 per cent of GRP growth occurred in capital cities, with an average growth rate of 3.2 per cent per year. Mining regions had an average growth of 5.9 per cent per year and non-mining regions grew at 2.5 per cent per year. Department of Industry, Innovation and Science. (2018). Industry Insights (1/2018) Flexibility and Growth.
13 David Gruen. 2017. Policy. #33 (iii). The Future of Work. Centre for Independent Studies
14 In a recent speech my colleague from Prime Minister and Cabinet, David Gruen very succinctly explored these issues. Australian Conference of Economists, (2018). Chief Economist Panel: The Future of Work; Australia's Place in the World.
15 AlphaBeta for Google Australia. (2017). The Automation Advantage. Retrieved from www.alphabeta.com/our-research/the-automation-advantage/
16 Borland, J. (2017). Job insecurity in Australia—no rising story. Labour Market Snapshot #39
17 David, PA. (1990). ‘The dynamo and the computer: an historical perspective on the productivity paradox". American Economic Review.
18 World Bank. (2018). Urban population (% of total). Retrieved from data.worldbank.org/indicator/SP.URB.TOTL.IN.ZS?view=map
19 United Nations. (2018) World Urbanization Prospects 2018. Retrieved from www.un.org/development/desa/publications/2018-revision-of-world-urbanization-prospects.html
20 Ahrend et al. (2017). What makes cities more productive? Evidence from five OECD countries on the role of urban governance. Journal of Regional Science. 57 (3).
21 Glaeser, E.L. (2011). Triumph of the City—How Urban Spaces Make Us Human. MacMillan. United Kingdom
22 Moretti, E. (2012). The New Geography of Jobs. Houghton Mifflin Harcourt.
23 Glaeser, E.L, Resseger, M, G. (2009). The Complementarity Between Cities and Skills. Working Paper 15103. National Bureau of Economic Research.
24 Parliament of Australia (2017). The National Disability Insurance Scheme: a quick guide. Retrieved from https://www.aph.gov.au/About_Parliament/Parliamentary_Departments/Parliamentary_Library/pubs/rp/rp1617/Quick_Guides/NDIS
25 Department of Social Services. (2018). DSS Payment Demographic Data. Retrieved from data.gov.au/dataset/dss-payment-demographic-data and Department of Social Services. (1978). Annual Report 1977–78.
26 For an interesting discussion of this issue from a UK perspective see Francis Maude's speech, Speaker's Lecture—The Future for the Civil Service retrieved from www.scribd.com/document/358809909/Speaker-s-Lecture-Maude
27 Gruen, N. (2017). Evidence based policy: Why is progress so slow and what can be done about it?. Retrieved from apoorgau.files.wordpress.com/2017/12/apo-forum-2017-session4-gruen-slides.pdf
28 Edelman. (2018), 2018 Edelman Trust Barometer Global Report, page 6. Retrieved from edl.mn/2suM6O5
29 OECD. (2017). Government at a glance 2017. Retrieved from www.oecd.org/gov/government-at-a-glance-2017-highlights-en.pdf